Nitrogen Fixation Rate of Genus Robinia in Northeast U.S.

Hi everyone, I am Eleen – (soon-to-be) second-year master student at Columbia University Ecology, Evolution, and Environmental Biology department. I study ecosystem ecology, broadly interested in nutrient cycling. My current work is focusing on Nitrogen (N) cycling in temperate forest ecosystems.

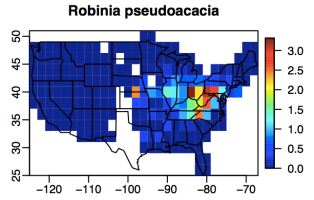
One of the major supply of N in terrestrial forest ecosystem is N fixation by free-living or symbiotic microbes that live in the root nodules of N-fixing plants. My research is primarily focusing on symbiotic N fixation (SNF): SNF is a process of converting atmospheric N2 into plant-available N by microbes. It is crucial in global n cycle, especially important in temperate forests, where N commonly limits primary production. SNF is also essential in conservation because of its capability of jump-starting recovery in abandoned and nutrient-poor systems to facilitate nutrient restoration and succession. In coterminous U.S., the estimated N input combining both N deposition and other types of N fixation besides symbiotic N fixation is <20kg N/ha year (Holland and Braswell 2004, Reed et al 2011). Based on a rough estimate, N fixers have the potential to be the greatest N input source on a continental scale (Sprent and Parsons 2000). Based on the recent Forest Inventory Analysis (FIA) data analysis (Liao and Menge Unpublished), there are in total 12831 N fixing trees recorded since 1980s. Genus Robinia (Figure 1) is the most common of six native N-fixing genera across U.S.: on a regional scale, this genus is particularly important in northeast region (Figure 2) where it comprises 95.6% of N fixer biomass. Despite the recognized importance, we currently do not have an accurate understanding of SNF rates of genus Robinia in this region or how they vary with tree age. My summer plan is to conduct a systematic analysis of Robinia SNF rates across tree ages in a northeast temperate forest.

(Figure1: Robinia at Central Park)


Robinia distributionRobinia distribution

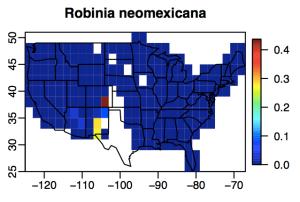
(Figure 2: Distribution of Robinia across U.S. Color shows percent basal area. (Menge et al 2010))

There are different ways of measuring SNF rates- each has advantages and limitations. The most commonly used methods include 15N enrichment experiment, acetylene reduction assay, and d15N natural abundance method. 15N enrichment experiment allows ecosystem-level analysis but is high-costly. Acetylene reduction assay because of its invasive nature by excising nodules off might not capture the actual SNF rates under natural settings. In my summer research, a combined analysis of 15N isotope natural abundance and dendrological dating record will be used to approach SNF rate of Robinia across age groups. I will sample 15 pairs of adult Robinia trees and neighboring non-N-fixing trees at Black Rock Forest (BRF), assuming they access the same soil nutrient pool. By coring the trees, dividing tree cores into different age groups, and comparing the isotope signals of Robinia and reference non-N-fixing tree I will be able to understand the amount of N fixed and the rate of SNF of genus Robinia in this forest and thus provide an estimate of SNF rates in northeast region.

Before going down to the field and start coring trees, I will spend/have been spending my time compiling literature that have reported SNF rates of Robinia and other N-fixing genera across coterminous U.S. In addition to literature review, I also will continue figuring out the best way to extract isotope signals from tree cores. Ultimately the data with literature estimates of SNF rates and experimental measurements of SNF rates will be combined with FIA database to estimate SNF at a continental scale, providing the first ever map of nationwide SNF estimates.


Reference:

Holland, E. A., B. H. Braswell, J. Sulzman, and J.-F. Lamarque. 2004. Nitrogen Depositio to the United States and Western Europe. Data set. Available on-line [http://www.daac.ornl.gov] from Oak Ridge National Laboratory Distributed Active Archive Center, Oak Ridge, Tennessee, U.S.A.n on

Menge, D.N.L., DeNoyer J.L., and Lichstein J.W. 2010. Phylogenetic constraints do not explain the rarity of nitrogen-fixing trees in late-successional temperate forests. PLoS ONE 5(8): e12056.

Reed, S. C., C. C. Cleveland, and A. R. Townsend. 2011. Functional Ecology of Free-Living Nitrogen Fixation: A Contemporary Perspective. Annual Review of Ecology, Evolution, and Systematics 42:489–512.

Sprent, J., and R. Parsons. 2000. Nitrogen fixation in legume and non-legume trees. Field Crops Research 65:183–196.

Preparations of a Lab Rat

Welcome to the first text post of the summer! I’m Natalie Hofmeister, one of two Natalies in this group, and this summer I’ll be writing about my work in the Rubenstein lab here at Columbia. Given that most of us are in transit or getting settled at field sites, I’m starting us off with a run-down of what I’ve been doing to prepare for the summer. In a two-year Master’s program like Columbia’s, we complete the bulk of our thesis research during the summer in between academic years. However, there is a lot of preparation to be done before the summer begins: writing grants, planning methods, ordering equipment and supplies, and – of course – lots of reading. For me, preparation meant a semester of primer design and testing before I could get to data collection.

My thesis focuses on signatures of evolution in the glucocorticoid receptor, a gene that is critically important in the production of the stress response. To look at variation in this gene (NR3C1, which stands for nuclear receptor subfamily 3, group C, member 1*), the first step was designing primers for each of the eight exons. Beginning in January 2014, I spent many hours on the computer and in the laboratory, designing and optimizing primers. Luckily, I had a great teacher (Joe Solomon, thanks for your help!), and after a few months I now have primers for all eight exons and I’m ready to start collecting data.

*Finding that all of these strange combinations of letters and numbers in molecular biology actually mean something definitely made life a lot easier to understand.

Superb starlings, one of the species I study (Pedro Fernandes, Cornell Lab of Ornithology).

Superb starlings, one of the species I study (Pedro Fernandes, Cornell Lab of Ornithology).

So, what goes on behind-the-scenes? Many molecular projects go through the same steps I did this spring, so I’ll try to demystify what we do in the lab.

1. Half of my time this spring was spent designing primers and aligning NR3C1 sequences on Geneious. Obviously, I needed to begin my project by learning to use the software that could analyze all of my sequences. So, I started at the computer, trouble-shooting in Geneious. First, I aligned the superb starling transcriptome (constructed by Joe Solomon) to putative sequences of NR3C1 in the zebra finch and the chicken. Once I developed a hypothesis of the starling NR3C1, I designed primers for each exon using the built-in commands in Geneious. The image below shows an example of a primer with the selection criteria we use to judge which primer is best; generally speaking, you want a primer with about 45% GC content and low scores for dimer and hairpin formation.

An example of primer design in Geneious from the manual (v5.3.6).

An example of primer design in Geneious (Geneious Manual v5.3.6).


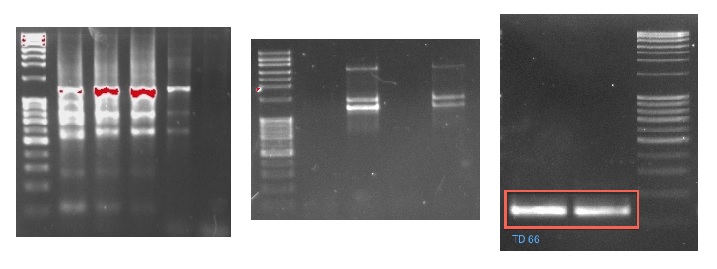
2. I spent the other half of my spring testing those primers. Usually, in testing primers you start with a temperature optimization to test the primers at many different annealing temperatures, and then proceed to magnesium optimizations to clean up the bands on a gel. Unfortunately, these optimizations don’t always get you pretty bands. Below, I show two unpretty gels and one lovely gel (with the bands boxed in red).

These are a few of the gels I ran to test primers this spring. The left-most gel was one of the worst (see the streaking), while the gel on the right shows clear and bright bands.

These are a few of the gels I ran to test primers this spring. The left-most gel was one of the worst (see the streaking), while the gel on the right shows clear and bright bands.

I used touchdown PCR to get the beautiful bands in the gel on the far right. I’d been working on a particularly troublesome exon for a few weeks when my PI suggested I try touchdown PCR (TD-PCR). This protocol gradually decreases the annealing temperature of a reaction, literally “touching down” by one degree in each subsequent cycle, which selectively amplifies the product that amplified at the highest annealing temperature. For more information on TD-PCR, see Korbie and Mattick 2008.


Next step: moving on to this guy! I'll be sequencing on a machine like this one (the ABI 3730) at AMNH this month.

Next step: moving on to this guy! I’ll be sequencing on a machine like this one (the ABI 3730) at AMNH this month.


Now that I’ve finished up this preliminary work, I’ll be shuttling back and forth between the Rubenstein lab and the Sackler lab at AMNH, where I’ll complete the actual sequencing of NR3C1 (using a machine like the one shown above). Stay tuned for some (hopefully forthcoming) results!

Breaking Bio Blitz – Cynthia Malone

Hello everyone and welcome to CU in the Field! As you will see in the About Me section, this is a blog run by some of Columbia University’s Conservation Biology Masters students, where we will be posting as often as we can about our summer research endeavors. Stay tuned for photos, videos, blog posts, and video interviews we conducted with Breaking Bio, a great group of biologists who put out podcasts about biology, science, and academic life. Here is the first Breaking Bio Blitz interview with the lovely Cynthia Malone, who is studying oil palm plantations in Cameroon!

Featured Photo credit: 100r.org